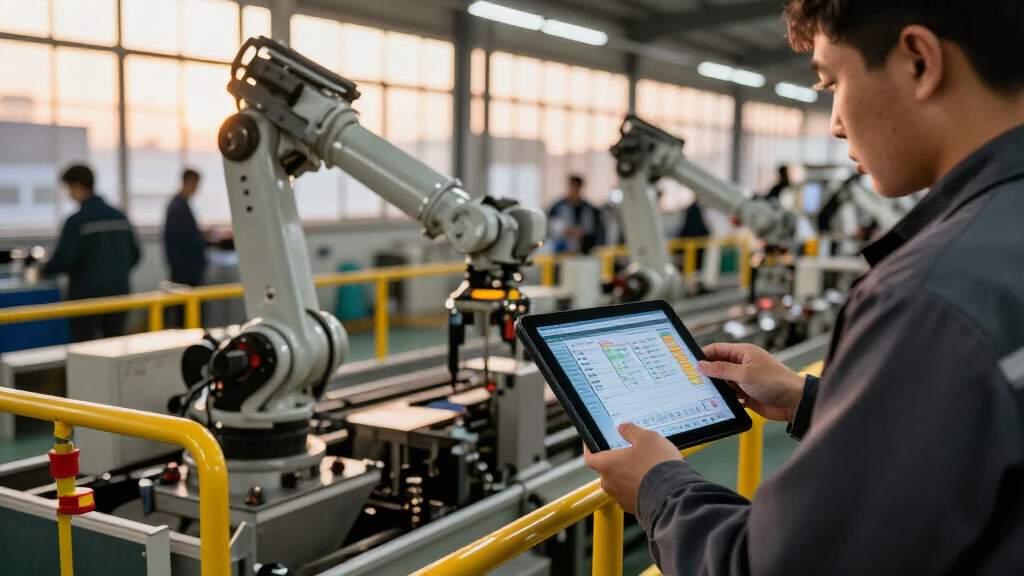
🔍 Read the full analysis: Factory Work’s Changing Path In The AI Age on ThorstenMeyerAI.com

Get the latest gadgets delivered free with Prime
- Fast, free delivery on millions of items
- Prime Video, Amazon Music and more included
- Member-only deals all year
TL;DR
US factory employment stood at a preliminary 12.7 million in October 2026, down about 35% from its June 1979 peak, while manufacturing output was 1.95 times its 1979 level in September. The figures describe a long shift in factory work, but output has remained below its 2007 peak, and the supplied account does not establish AI as the cause of the employment decline.
US factories employed a preliminary 12.7 million people in October 2026, about 35% fewer than the 19.6 million peak in June 1979, even as manufacturing output in September 2026 was nearly twice its 1979 level. The figures, reported by ThorstenMeyerAI.com on November 8, trace a long-running change in factory work; they do not show that artificial intelligence caused the decline.
The report bases its US job figures on the Bureau of Labor Statistics’ Current Employment Statistics series, which counts payroll jobs at employers outside farming and excludes self-employed workers and private household employees. The series begins in 1939. Factory jobs reached 19,553,000 in June 1979, the highest monthly figure in that record, then fell to 12.7 million in October 2026, a preliminary estimate. That latest count represented 8.0% of US payroll jobs.
The decline was especially steep from January 2000 to February 2010, when factory employment fell from 17.3 million to 11.4 million, a loss of almost six million jobs. Employment later recovered somewhat, dropped during the 2020 Covid shock and then stood at the October 2026 level. Separately, the report says the Federal Reserve’s manufacturing production index rose from 50.4 in June 1979 to 98.4 in September 2026, using an index with 2017 set to 100. That is 1.95 times the 1979 level.
The report cautions against reading that long-term output comparison as an unbroken rise: US factory output reached a high of 108.6 in December 2007 and remained about 9% below that peak in September 2026. Its estimate that output per factory job was roughly three times as high as in 1979 is the author’s calculation, comparing output with job counts rather than hours worked.
Fewer Factory Jobs, Higher Output
The figures show why factory employment and industrial production should not be treated as interchangeable measures of manufacturing’s place in the economy. The United States produced substantially more than in 1979 while employing fewer factory workers, but the longer-term record also shows that output has not continued to climb: it remains below its December 2007 high. Both employment and production matter when evaluating the state of manufacturing.
For workers and communities, the fall from the 1979 employment peak marks a large change in the number of jobs directly counted in factories. For policymakers and businesses considering automation, reshoring or AI, the report supplies historical context—not evidence that any one technology explains the change. It does not quantify AI’s effect on factory hiring, productivity or wages.
Products Worth Considering

LG UltraGear 32GS60QC-B 32-inch Curved QHD Gaming Monitor (180Hz, 1ms, 1000R, AMD FreeSync, HDR10)

Jackery Explorer 300 Portable Power Station with 40W Solar Panel

DJI Osmo Pocket 3 Creator Combo 4K Vlogging Camera
As an affiliate, we earn on qualifying purchases.
How Factory Employment Reached Its Peak
Factory employment’s share of US payroll jobs reached its high much earlier than its total number. In November 1943, factories accounted for 38.8% of payroll jobs, compared with 21.7% in June 1979 and 8.0% in October 2026. The number of factory jobs continued rising after the share began to fall, reaching its peak in 1979 as the wider economy expanded.
The report also places the US trend alongside other economies. In West Germany, industry and construction accounted for 49.2% of workers in 1965; the corresponding share for Germany was 22.9% in 2025, under the category used by its statistical office. In China, the report says jobs in industry and construction peaked at 232 million in 2012. These figures use different national categories and should not be read as directly identical measures.
The familiar explanation that US factory jobs simply “went to China” is incomplete, according to the report. It says the US decline began 22 years before China joined the World Trade Organization. Citing economists’ estimates, it says rising Chinese imports may have cost up to about one million US factory jobs from 1999 to 2011, out of almost six million lost over that period. The figures do not attribute the full decline to trade.
““The number to remember is 19.6 million.””
— Thorsten Meyer, ThorstenMeyerAI.com
What the Figures Cannot Establish
The October 2026 US factory employment estimate is identified as preliminary and may be revised. The supplied report does not provide a detailed breakdown of the latest job changes by industry, occupation, region or employer, nor does it measure how many jobs were affected by AI or other forms of automation.
The roughly threefold output-per-job comparison is explicitly a rough calculation based on production and job counts, not hours worked. It does not show how output, working time, wages or job quality changed for individual employees. The report also does not provide enough detail to assess every factor behind the employment decline, including trade, business cycles, productivity improvements and shifts in demand.
Watch Revisions and Output Trends
The next near-term point to watch is whether the October 2026 employment estimate changes when the BLS releases revised data, and how subsequent monthly reports compare with the 12.7 million preliminary count. Future manufacturing production data will also show whether output moves closer to its 2007 peak or remains below it.
For a clearer account of AI’s role, readers would need evidence that separates AI adoption from other causes and tracks changes in factory jobs, tasks, hours and output over time. The report’s historical figures establish the scale and timing of the employment shift, but do not settle that question.
Key Questions
How many people worked in US factories in October 2026?
The report gives a preliminary figure of 12.7 million factory payroll jobs in October 2026, equal to 8.0% of US payroll jobs.
When did US factory employment peak?
It peaked at 19,553,000 jobs in June 1979 in the BLS payroll series cited by the report.
Was US manufacturing output higher in 2026 than in 1979?
Yes. The report says the manufacturing production index was 1.95 times its June 1979 level in September 2026. However, it was still about 9% below its December 2007 peak.
Does the report show that AI caused factory job losses?
No. It describes long-term employment and output trends but does not quantify AI’s effect or identify it as the cause of the decline.
Did factory jobs simply move from the United States to China?
The report says that explanation is only partly supported: the US decline began before China joined the WTO, and cited estimates attribute up to about one million lost US factory jobs from 1999 to 2011 to rising Chinese imports, out of almost six million lost overall.
Source: ThorstenMeyerAI.com